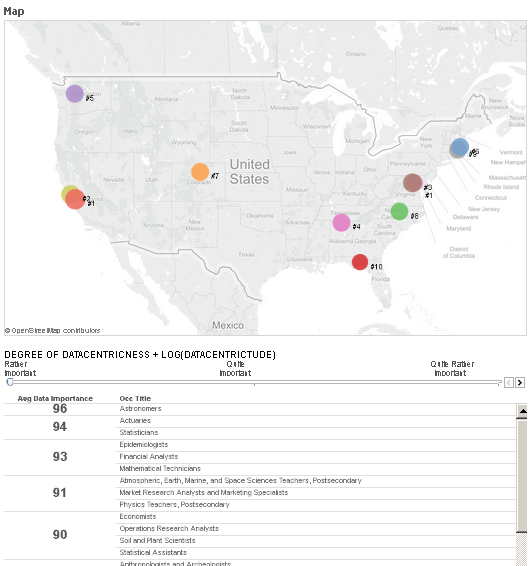
Visualization based on analysis performed in the "The Importance of Data Occupations in the U.S. Economy" report created by the
Economics & Statistics Administration agency but looking at metropolitan areas instead of states and interactively allowing for
a greater focus on the more datacentric occupations.


A Tableau data visualization that summarizes expected employment growth by occupation,
linked with various levels of educational attainment.