GenChart
What
A ClickOnce-deployed utility, accessed via a pseudo-ActiveX control hosted in a Summation window, for counting the file extensions of ediscovery documents
present in a database. Results are displayed in a pie chart, with optional export of data to Excel 2007.
How
Uses the swsom .Net wrapper to read the 'Linked Document Field' from displayed records and parse out the individual file extensions. A JPEG image is created on the fly,
with the DocLink tally information serialized into XML. If appropriate prerequisites are in place, a Visual Studio Tools for Office (VSTO) document-level project
provides the ability to load the XML and auto-generate a native Excel chart.
Why
To get a quick read on the contents of an ediscovery dataset.
Where
Check for prerequisites and install from here GenChart.

Usage
Installing and/or running the GenChart ClickOnce package will result in a number of files being copied into a new subfolder (oweng.GenChart) under the
Application-level profile directory within Summation e.g. C:\Program Files\Summation\Blaze\Profiles\ogalvin\oweng.GenChart. Once the files are in place,
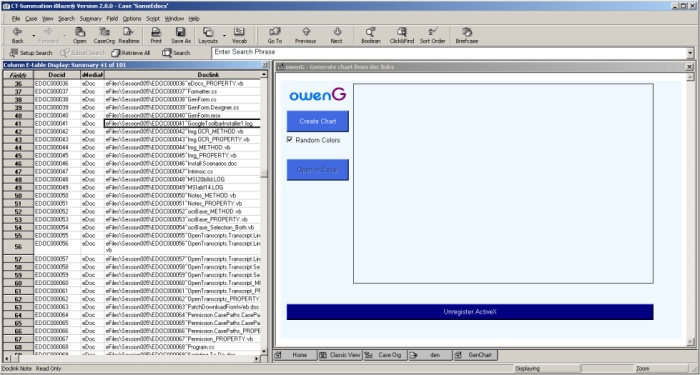
a new tabbed window (aka 'View') will open within Summation, hosting the controls needed to count the data:
|
There are a number of scenarios that may result in an error message appearing during the file copy process, where the errors may be safely ignored. Essentially this happens
when the program files dropped by the initial ClickOnce installation are locked by Summation, preventing them from being overwritten by a subsequent ClickOnce file copy.
For technical reasons, the file copy happens every time the GenChart ClickOnce application is opened, even though the same exact files (same version etc.) may already
be in place and ready for use. This file copy is a good thing if a newer version of GenChart has been installed since the last time the application was opened but otherwise is
simply a side effect of deploying this type of ActiveX control via ClickOnce. In any case, closing and re-opening Summation will clear the file locks.
|
Once the desired recordset is available in the Column or Form view, click the 'Create Chart' button within the new View. GenChart will take a snapshot (Clone) of the
data in each record's DocLink field (as defined in 'Linked Document Field' on the Link Fields tab of Summation Defaults dialog) and attempt to parse out the value's
file extension. The initial Clone process may take anywhere from a few seconds to a minute or more, depending on the number of records currently displayed in Summation.
|
NOTE: the app makes no attempt to confirm the file's identity by examining the file's internal metadata - a Word document renamed with a .txt
extension will simply be counted as '.txt.'
|
Empty values are ignored and the final tally figures do not take these records into account.
The ten extensions with the highest count are preserved and sorted, highest to lowest. If the corpus of edocs spanned more than ten file extensions, the extensions that didn't register on the 'top ten' list are all lumped
together into an 'other' category.
By default the pie slices will be generated with random colors, which may result in adjacent slices that are not chromatically
distinct. Re-run the app with same default to get new random colors, or uncheck the 'Use Random Colors' checkbox' beforehand so that the chart is displayed with
standard, distinct colors.
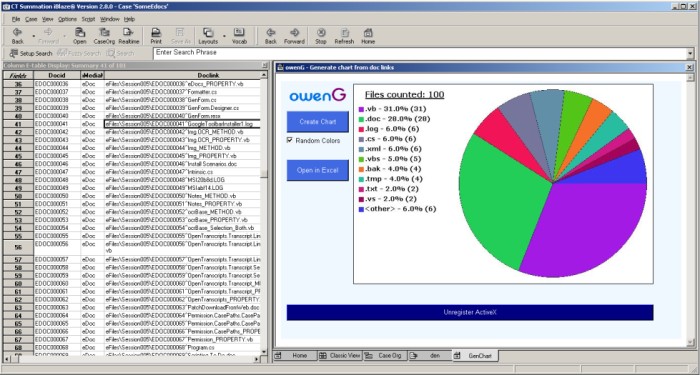
The chart's legend will include total files counted (records with a doc link value that could be parsed into a file extension) and separate
counts for each file extension - percent of total followed by raw count in parentheses.
After the image has been loaded a GenChart.xml file will be generated, persisting the tally amounts.
Clicking 'Create Chart' will always result in the app analyzing the current recordset and generating a new GenChart.jpg (overwriting previous). Searches, custodian-specific
or other, can be repeatedly performed, followed each time by re-running GenChart via the 'Create Chart' button.
A completed chart:
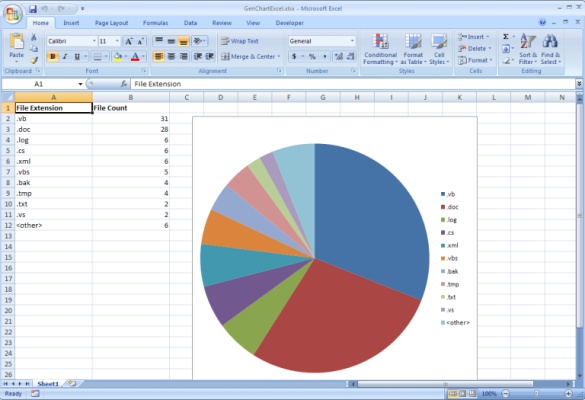
Once a given recordset has been processed, the 'Export to Excel' button becomes available, though the feature can only be taken advantage of if Excel 2007 and
version 3.5 of the Microsoft .Net Framework have both been installed. Clicking the button will open the GenChartExcel.xlsx file dropped by the GenChartLauncher, which
in turn will 1) analyze the GenChart.xml file mentioned above, 2) transfer the file extension data into worksheet cells, and 3) draw a simple Excel pie chart based on
those values. Within Excel the chart type can be changed if desired.
Cleanup and Removal
Uninstalling the GenChartLauncher application via Add/Remove Programs will remove the source files from their original ClickOnce application directory but there are
additional steps for a full cleanup. First, before uninstalling, run the application so that the new Summation View is created. Then click the
'Unregister ActiveX' button-bar at the bottom of the window, which will remove the two registry entries that had been created by the app. (As an alternative to re-initiating
the GenChart Summation View only in order to unregister, there should be an UnregisterGenChartDLL.bat in the oweng.GenChart folder discussed below.)
Next, close Summation in order to remove any file locks and, assuming there is no data you wish to save, delete the oweng.GenChart folder under the user's application-level
profile directory e.g. C:\Program Files\Summation\Blaze\Profiles\ogalvin\oweng.GenChart. Finally, uninstall GenChartLauncher via Add/Remove Programs.

Technical Details
Appropriate App Approach
The easiest way of providing a rich UI while interacting with Summation programmatically would probably be to simply create a standalone WinForm .exe but I like the
elegance of embedding an application within an ActiveX container as per Embedding VB Applications in CT Summation.
Other integration possibilities included adding a new context-menu item to the core db columnar view or adding a button to Excel itself via Visual Studio Tools for Office.
The former option can get a little tricky when dealing with the possibility of existing .mxs Context Menu Files at a variety of user/case levels and the latter idea would
have introduced its own problems in terms of necessary prerequistes.
Deciding to pursue the embed-in-view idea I investigated a number of possible implementations:
Hosting .Net Windows Control in IE, via # syntax
You can use Visual Studio to create a Windows Forms Control Library, add any number of standard controls or create your own custom ones, and wrap up into a .dll. The result
is a visually appealing, feature-rich UI that can then be hosted in Internet Explorer using simple markup code on the HTML side. For example, assuming there is a Windows Form Library
DLL named WinFormLib.dll that holds a UserControl class named MyUserControl, that control can be hosted in an IE window with only a few lines of HTML. Within the classid
attribute value, the first part is the full path to the .dll (WinControlLib.dll), followed by the fully qualified name of the control (WinControlLib.MyUserControl), with a pound sign
(#) separating the two:
HTML
    <object
        id="Object1"
        classid="WinControlLib.dll#WinControlLib.MyUserControl"
        height="700" width="550">
    </object>
Which is all well and good when the ASP.NET page can be rendered via IIS i.e. over the internet or an intranet. I would in fact consider the latter intranet solution
to be the best overall, since presumably the necessary Code Access permissions could be configured as needed, it being an intranet and all. Although an assembly from the
Intranet Zone would natively have somewhat looser security restrictions than something working from the Internet Zone, what it comes down to is that anything needing to interact with
unmanaged code (like the Summation API) would need full trust.
On the other hand, one might assume that everything would work fine if the .dll were accessed from the local hard drive, which would tend to imply broader security permissions.
Presumably this is not a common scenario, which is why I initially couldn't find any documentation regarding expected behavior. I tried a number of possible workarounds,
troubleshooting the resulting fusion bind errors etc. but it wasn't until I more or less gave up on this approach that I came across
PRB: Cannot Host .NET User Controls in Internet Explorer 6.0 from File System,
which states the cannot-use-local-windows-control-in-IE behavior is by design, because of security concerns. That article instead recommends installing the assembly into the GAC,
which seems significantly more heavy handed than my eventual choice, which was to make the appropriate COM entries in the Windows Registry.
C++ MFC ActiveX Control
The only project type I could find in Visual Studio 2008 that referenced the ActiveX techology was the one for an MFC ActiveX Control, available under C++. For a little
while there seemed a chance this might actually work. Then after a few hours of playing around reality intruded, primarily in the form of a steep learning curve. I've done
some relatively straightforward work in C++, including with MFC apps, but not for a few years and pursuing this option didn't seem worthwhile in terms of time investment
vs. likely benefits (would need to be registered anyway?). And I did do enough research to make me believe the necessary type of ActiveX component, and ActiveX document,
might not be supported anyways.
Hosting Windows Control in IE, as COM-visible ActiveX
Finally, returning to more of a traditional ActiveX approach, though only traditional in that the .Net component would need to be registered on the host machine and then
referenced in the .htm file with the clsid syntax:
HTML
    <object
        id="mainControl"
        classid="clsid:29BFC741-B8B0-4ad0-9F49-693FD73E8CF8"
        height="100%" width="100%">
    </object>
The first concern here was setting everything up so that the control was properly registered and visible and for that I would need to thank Michal Kosmala and his
Create ActiveX in .NET Step by Step article up on www.codeproject.com. The implementation details
are discussed below but the downside to this solution include the need to make Registry entries in the first place and the later difficulty in cleaning up said entries on uninstallation. It would be nice to
avoid the Registry and the whole spirit of the ClickOnce technology is to make a very light footprint on the target machine. On the other hand it struck me as 'good enough'
and the best of the alternatives. ClickOnce does generally allow for deploying COM components in a way that avoids registration but ActiveX Document (and ActiveX EXE)
projects are specifically not supported.
|
And the whole COM registration process worked fine, assuming adequate permissions, when testing in XP. Once everything seemed to be operating correctly I looked at the
app in Windows 7, where attempting the .dll registration resulted in a System.UnauthorizedAccess exception. Specifically, the HKCR\owenG.GenChart.GenChartCtrl key could not be
created. I'm presuming the same error would occur in Vista and perhaps the problem could be sledgehammered away by turning off User Account Control entirely. I did spend
some time trying to come up with a more fine-tuned workaround but between resource constraints (OS/hardware) and no compelling need at this point, I deferred. Also, as noted
above, a real solution would not involve COM at all.
|
Initial Setup
After selecting the 'hybrid Windows Control via ActiveX clsid reference' approach, the next hurdle dealt with how to actually deploy the files. In theory all of the
application files could have remained in their original ClickOnce directory, which would be in some obfuscated directory under
C:\Documents and Settings\. The relative complexity of having three different sets of assemblies interact made selecting a single known target
directory seem like a better idea, where swsom is used to determine the current user's profile directory at the app level (sw.Application.AppProfile) and create a new
sub-directory there, \owenG.GenChart.
The deploy steps wind up going something like:
- The GenChartLauncher ClickOnce application is installed, where its job is really to serve as a delivery mechanism for the GenChart control and VSTO .dll/.xlsx combo. On
the Visual Studio project level, it is pretty much a WinForm app w/o a Form that has been marked as COM visible. The next steps happen each time the app is launched, which
is not ideal but at least allows everything to function while still taking advantage of ClickOnce.
- After making sure Summation is running, the GenChart binaries are copied to the current user's Summation profile, as mentioned above. If the GenChart Summation view
is already open at this point, there will likely be file copy problems, as noted under Usage. At a minimum I really should be checking file versions of existing .dlls
before bothering to try and overwrite but that step awaits a future day.
- With the GenChart files in place, including a host.htm that references the clsid of the GenChart control, the RegistrationServices.RegisterAssembly() method is used
to register GenChart.dll.
- Finally, (swsom)sw.Views.CreateHtmlView is used to create a new Tabbed view, passing in the file path to host.htm as the url.
Having put the target files in place, registered the ActiveX control and created a Summation view for the host.htm, the actual ClickOnce application (GenChartLauncher),
is more or less out of the picture.
Getting the raw data
Clicking 'Create Chart' results in the generation of a GenChart.jpg file, which is then displayed in the control's PictureBox. Formulating that image file takes a bit of
doing though. The first substantive step is to check to see if the 'doc link' field exists in the table currently loaded into Summation:
C#
    string doclinkFieldName = sw.DB.Defaults.LinkCol;
    if (sw.DB.Fields.Exists(doclinkFieldName))
    {
Once that is confirmed, it is time to get the actual doclink values from the database. For the first pass I tried direct access to the database, which worked just fine
if there were only a few records:
C#
    sw.DB.Field fld = new sw.DB.Field(sw.DB.Defaults.LinkCol);
    ...
    object val = fld.Value;
    if (val != DBNull)
    {
        string docLinkValue = (string)val;
For any appreciable number of records though, using the Clone method on Summation's db object proved much superior, where it was only necessary to Clone the
doclink field:
C#
    ADODB.Recordset rs = sw.DB.Clone(1, sw.DB.Defaults.LinkCol, ",", false);
    ...
    string val = rs.Fields[0].Value as string;
    if (val != null)
    {
I later did some comparisons between the two different methods of data access, which demonstrate the greater performance of db.Clone. The primary disadvantage,
not relevant for GenChart, is of course that the data is read-only. With CT Summation Enterprise a second advantage to Clone is that db values comes across clearly,
where some versions of that product have problems reading directly data using the db object (at least in earlier Enterprise versions).
| Record Count | Using (swsom)sw.db.Clone | Direct (swsom)sw.db field access |
|---|
| 100 | .08 seconds | 18.5 seconds |
| 1000 | 1 second | 3 min., 4 seconds |
| 10000 | 8.25 seconds | I'm guessing a while; 2000 recs = 5.5 min. |
- All of the summaries in recordsets had populated doclink fields
- Tests run on local VM, RAM constrained to 1 GB
- Time elapsed values include walking the recordset and extracting a file extension from doclink field
"The greater part of progress is the desire for progress"
In order to provide an accurate progress display in the control window, a delegate was declared in the class (Charter) that is doing all of the processing and I
added a RecordsReviewed event based on that delegate:
C#
    class Charter
    {
        public delegate void UpdateProgressBar();
        public event UpdateProgressBar RecordsReviewed;
Within the loop of the Charter method responsible for walking cloned recordset the RecordsReviewed event is fired every 10 records:
C#
    countRecords++;
    if (countRecords % 10 == 0)
    {
        RecordsReviewed();
    }
Then the UI class of the main user control (GenChartCtrl) the Maximum in the progress bar control is set to the recset count and the chart_RecordsReviewed
function subscribed to the RecordsReviewed event:
C#
    public partial class GenChartCtrl : UserControl
    {
        ...
        progRecset.Maximum = (int)sw.DB.RecordCount;
        Charter chart = new Charter();
        chart.RecordsReviewed += new Charter.UpdateProgressBar(chart_RecordsReviewed);
And this RecordsReviewed subscriber, chart_RecordsReviewed, is resposible for advancing the progress bar:
C#
    public void chart_RecordsReviewed()
    {
        //where Step value is set to 10, matching the modulo trigger in the Charter class
        //progbar range is from 0 to total # of records
        progRecset.PerformStep();
    }
GetFileExtension
Meanwhile, the main code tries to parse out a file extension from the doclink value, using a combination of (System.IO)FileInfo.Extension and a series of more
manual calculations.
|
The file paths that were most likely to result in FileInfo.Extension failure were those that were email attachments and either really did not have a file extension: |
| e.g. eMail\Session006\PSTXYZ003336^CPB-TXT_zip |
| or were .msg files with an illegal path character, most often a colon in from a Re: subject line: |
| e.g. eMail\Session008\PSTXYZ003974^RE: How to make.msg |
| |
| If FileInfo.Extension call fails, the parsing attempt on the doclink value consists of: |
| - confirming there is a least one backslash |
| - finding the final '.', with any characters after that becoming the file extension |
| Record will be skipped if there is no backslash and/or no period character. |
|
The tally for each valid file extension is stored in a generic Dictionary<string, int>, where if a given file extension is already stored in the Dictionary
(via TKey string), it is removed and re-added with an incremented count (TValue int). When all the records have been processed, the Dictionary is transmogrified into a
List<KeyValuePair<string, int>> (
http://stackoverflow.com/questions/289/how-do-you-sort-a-c-dictionary-by-value) which then means it can be sorted, by highest count. The ten file
extensions with the highest tally are preserved, while the rest are thrown out. A dummy "<other>" key with count = 0 is appended and the final kvp List is
returned to the calling procedure.
Pie Making
The following set of code blocks are all contiguous, where the CreateImage method is in the Charter class and is called directly from the GenChartCtrl user control.
The parameters for CreateImage are:
* filename = Summation user profile directory at app level + oweng.GenChart\ + GenChart.jpg
* rect = PictureBox.Bounds in GenChartCtrl
* useRandomColors = check state of that box in User Control UI
* xmlFileName = file name to which data will be exported
C#
    public void CreateImage(string filename, Rectangle rect, bool useRandomColors, string xmlFileName)
    {
        int width = rect.Width, height = rect.Height;
        Bitmap myBitmap = new Bitmap(width, height);
        Graphics g = Graphics.FromImage(myBitmap);
        g.Clear(Color.White);
DocLinkInfo is a very simple class, taking a string (file extension) and int (extension count) in its constructor. It has a couple of Xml Serialization attributes
and exists only to make the export of data into XML file simple.
C#
        List<DocLinkInfo> doclinks = new List<DocLinkInfo>();
The FillSlices method returns the List that holds all the tally info, with total = the total count of valid file extensions.
C#
        int total = 0;
        List<KeyValuePair<string, int>> slices = FillSlices(out total);
        if (slices.Count > 0)
        {
            Random rnd = new Random();
            Rectangle pieRect = new Rectangle(210, 10, 375, 375);
            float deg = 0;
            int totalDrawn = 0;
            int baseY = 10;
            int counter = 0;
Iterate through each <file extension, count> pairing, first setting a color for what will become the related pie slice (colors is a string
array of basic colors).
C#
            foreach (KeyValuePair<string, int> kvp in slices)
            {
                SolidBrush brush = null;
                if (useRandomColors)
                {
                    brush = new SolidBrush(Color.FromArgb(rnd.Next(255), rnd.Next(255),
                        rnd.Next(255)));
                }
                else
                {
                    brush = new SolidBrush(Color.FromName(colors[counter]));
                    counter++;
                }
Pull out the data pairs. If the count = 0, must be on the dummy "<other>" key and its aggregate count can be deduced from the overall total minus what's been accounted
for already.
C#
                int extensionCount = kvp.Value;
                string extensionString = kvp.Key;
                if (extensionCount == 0)
                {
                    //on last kvp, for the agglomerated extensions that were not in top 10
                    extensionCount = total - totalDrawn;
                }
Create new DocLinkInfo object for current data pair and add to the List of DocLinkInfo's. Draw current extension's pie slice, after calculating
deg startAngle and arc sweepAngle.
C#
                DocLinkInfo info = new DocLinkInfo(extensionString, extensionCount);
                doclinks.Add(info);

                float percent = (float)extensionCount / total;
                float arc = percent * 360;
                Pen p = new Pen(Color.Black, 1);
                g.DrawPie(p, pieRect, deg, arc);
                g.FillPie(brush, pieRect, deg, arc);
                deg += arc;
Create the color square for the legend. If on the first slice, write out the legend header text.
C#
                Rectangle keyBox = new Rectangle(10, baseY + 5, 10, 10);
                if (totalDrawn == 0)
                {
                    Font legendFont = new Font("Verdana", 12, FontStyle.Bold | FontStyle.Underline);
                    string legendText = "Files counted: " + total;
                    g.DrawString(legendText, legendFont, new SolidBrush(Color.Black),
                        new Rectangle(keyBox.X + 10, baseY, 250, 20), StringFormat.GenericDefault);
                    baseY += 30;
                    keyBox.Y += 30;
                }
                g.FillRectangle(brush, keyBox);
Screen space for legend is limited, need to truncate any file extensions that are likely to result in text & pie occupying same pixels.
C#
                //Verdana is proportional, don't really #chars that would fit in a given space
                if (extensionString.Length > 12)
                {
                    extensionString = extensionString.Substring(0, 9) + "...";
                }
                Font f = new Font("Verdana", 10, FontStyle.Bold);
                string keyText = String.Format("{0} - {1:0.0%} ({2})",
                    extensionString, percent, extensionCount);
                g.DrawString(keyText, f, new SolidBrush(Color.Black),
                    new Rectangle(keyBox.X + 10, baseY, 275, 20), StringFormat.GenericDefault);
                baseY += 20;
                totalDrawn += kvp.Value;
            }
        }
If no parsable doclink values had ever been found ('slices.Count > 0' is not true), let user know via a graphic.
C#
        else
        {
            Font f = new Font("Verdana", 20, FontStyle.Bold);
            string doclinkFieldName = sw.DB.Defaults.LinkCol.ToUpper();
            if (doclinkFieldName.Length <= 0) doclinkFieldName = " 'Linked Document' ";
            string nothingFoundText = String.Format("Nothing found - no records with valid {0} field",
                 doclinkFieldName);
            g.DrawString(nothingFoundText, f, new SolidBrush(Color.Black),
                new Rectangle(100, 150, 500, 300), StringFormat.GenericDefault);
        }
Save the constructed Bitmap object as a .jpg. Call DocLinkInfoToXml to serialize as an .xml file (see method definition below).
C#
        myBitmap.Save(filename, System.Drawing.Imaging.ImageFormat.Jpeg);
        DocLinkInfoToXml(xmlFileName, doclinks);

        g.Dispose();
        myBitmap.Dispose();
    }  //end CreateImage
DocLinkInfoToXml definition
C#
    private void DocLinkInfoToXml(string xmlFileName, List<DocLinkInfo> doclinkInfoList)
    {
        XmlSerializer s = new XmlSerializer(typeof(List<DocLinkInfo>));
        TextWriter w = new StreamWriter(xmlFileName);
        s.Serialize(w, doclinkInfoList);
        w.Close();
    }
To Excel
Clicking 'Open in Excel', on the GenChart user control UI, doesn't do much more than try a Process.Start on the GenChartExcel.xlsx file. That file is actually the result
of a 'Excel 2007 Workbook' VSTO project in Visual Studio 2008 and in conjunction with it's companion GenChartToExcel12.dll is capable of loading the tally
data and creating a linked pie chart. Upon file open, which leads to calling of the default Sheet1_Startup method, the project will attempt to open the genchart.xml
(xmlFilePath) file. The xml file is loaded as an XmlDocument and then queried via XPath, where the query matches
the format of the serialized DocLinkInfo class in the GenChart control:
C#
    XmlDocument xmlDoc = new XmlDocument();
    xmlDoc.Load(xmlFilePath);
    XPathNavigator nav = xmlDoc.CreateNavigator();
    //the serialization process will have capitalized the first letter of type in ArrayOfO...,
    //though it will remain with orig lowercase in child elements
    XPathNodeIterator it = nav.Select("/ArrayOfOwenGGenChartdocLinkInfo/owenG.GenChart.docLinkInfo");
Then the code moves through each result from the Select statement, extracting the two needed values and writing them directly to descending cells in the first two
columns of the Excel worksheet:
C#
    index++;
    XPathNavigator navInner = it.Current;
    string ext = navInner.GetAttribute("extension", "");
    string cntString = navInner.GetAttribute("count", "");
    ((Excel.Range)Globals.Sheet1.Cells[index, 1]).Value2 = ext;
    int count = 0;
    if (int.TryParse(cntString, out count))
    {
        ((Excel.Range)Globals.Sheet1.Cells[index, 2]).Value2 = count;
    }
    else
    {
        ((Excel.Range)Globals.Sheet1.Cells[index, 2]).Value2 =
            "Error parsing number from count value in .xml";
    }
And finally a pie chart of defined size is created, using the newly written cells as source data:
C#
    Microsoft.Office.Tools.Excel.Chart pieChart;
    pieChart = this.Controls.AddChart(250, 20, 400, 400, "DocLink Info");
    pieChart.ChartType = Microsoft.Office.Interop.Excel.XlChartType.xlPie;

    string endingCell = String.Format("B{0}", index);
    Excel.Range docLinkRange = this.get_Range("A2", endingCell);
    pieChart.SetSourceData(docLinkRange, missing);